Last month, I wrote about a recent report comparing apples and oranges. More precisely, the National Public Pension Coalition (NPPC) claimed that state-run defined benefit plans offered better benefits than defined contribution plans.
As I pointed out at the time, the NPPC report ignored how much money was going into each of the plans, and they looked only at the retirement benefits offered to 35-year veterans, which sidestepped the question of how benefits accumulate over time.
But what if we take their comparison seriously and show what retirement benefits actually look like over the full career of a teacher? Before I show you the results, consider the inputs.
The NPPC report compared charter schools to traditional pension plans in eight states, California, Florida, Indiana, Louisiana, Michigan, North Carolina, Pennsylvania, and Wisconsin. Since I already had data on the traditional defined benefit pension system in Pennsylvania, I decided to focus there. Although Pennsylvania recently made changes to its retirement plan for new teachers, for illustrative purposes I’m going to show the system for current teachers. From the NPPC report, I pulled info on the defined contribution plan offered in their Pennsylvania comparison school, the Chester Charter School for the Arts. I assumed immediate vesting in the 403(b) plan, but otherwise I took the same investment return and inflation rate assumptions as the NPPC used*. Here’s what those plans look like:
| Pennsylvania’s Traditional Defined Benefit Plan | Chester Charter School for the Arts 403(b) Plan |
Employee contributions (as a % of salary) | 7.5% | 6% |
Employer contributions for benefits (% of salary) | 8.31% | 6% |
Employer unfunded liability (% of salary) | 20.89% | N/A |
Total contributions (% of salary) | 36.71% | 12% |
Investment return assumption | 7.25% | 6% |
Inflation assumption | 2.75% | 2 % |
Vesting period | 10 years | Immediate |
Formula multiplier | 2% | N/A |
Normal retirement age | Age 65 w/ 3 years of experience, or any age w/ 35 years of experience (and age + experience is greater than 92) | N/A |
As the table shows, it’s obvious that the NPPC report is comparing apples and oranges. To begin with, the contributions into the system are different. Teachers and employers are contributing far more money into Pennsylvania’s state-run defined benefit plan than they are into the Chester Charter School 403(b) plan. However, the state plan has run up huge unfunded liabilities, so traditional Pennsylvania districts are also contributing almost 21 percent of each teacher’s salary just to pay those down. After accounting for those liabilities, the traditional Pennsylvania system costs three times as much as what the charter school is offering.
As it will be clear later, when it comes to pension plans, retirement plan costs do not always translate into retirement plan benefits, and the Chester Charter School is offering a pretty good retirement plan. Its 6 percent employer match would put it in the top 10 percent of private retirement plans nationwide, and the total employer plus employee contribution rate of 12 percent should provide at least a floor of adequate retirement benefits. (Unlike teachers in 15 other states, Pennsylvania teachers in both plans are enrolled in Social Security.)
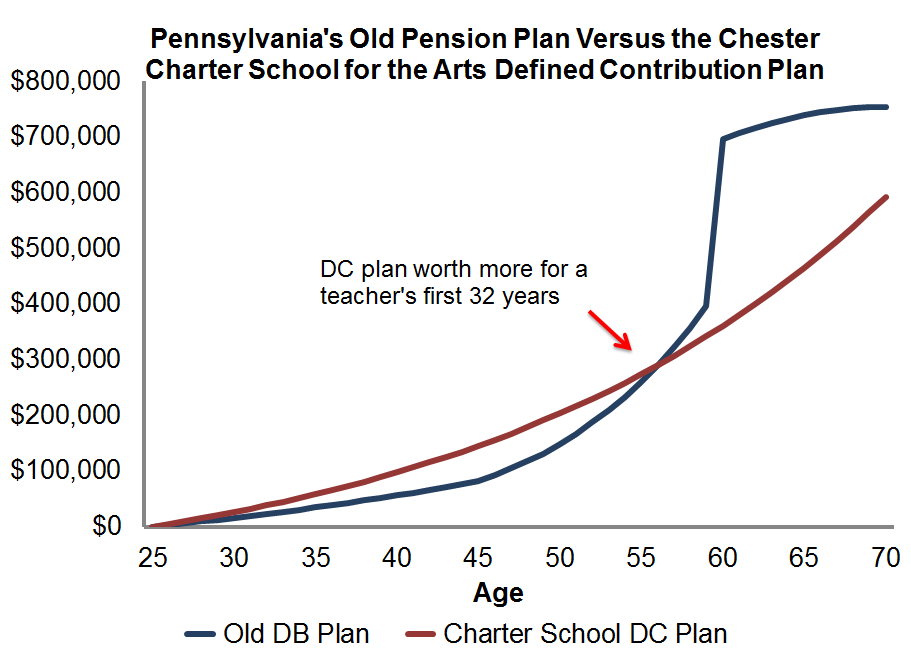
Ok, on to the results. In the graph below, the blue line shows how benefits accumulate under Pennsylvania’s old defined benefit plan. As in other states, benefits accrue very slowly for many years, and it isn’t until teachers near the state’s 35-year mark that the pension value really starts to climb. In contrast, the red line shows how retirement assets would accumulate under the Chester Charter School for Arts plan. Workers at all ages are accruing decent retirement benefits, regardless of how long they stay.
So which plan is “better” for teachers? The NPPC is right to point out that a 35-year veteran is better off under the old Pennsylvania defined benefit plan, at least based on retirement benefits alone. But that’s only part of the story. Remember that more than a third of her salary is going to pay for that benefit, and only a select group of teachers will reach that peak. According to the state’s own estimates, less than 1 percent of Pennsylvania teachers will stay that long. After zooming out and looking across the full working career, it becomes clearer that a portable benefit plan would be better for most teachers.
*For the sake of argument, I’ve taken the NPPC’s investment and inflation assumptions verbatim, but those result in a far lower return than what Pennsylvania assumes in its official projections. It’s not the main point of this post, but recent research has questioned whether defined benefit plans really earn a premium above what individuals earn in their defined contribution plans.
