Illinois recently passed landmark legislation to reform the state’s pension system. The law includes a number of reforms that reduce pension benefits for retirees and current employees. While the law does not affect Chicago teachers*, Mayor Rahm Emanuel has already voiced a need for similar reform in the Windy City. Union members have protested that position and recently formed a coalition to stop any changes in pension benefits. The Chicago Teachers’ Union recently released a report, titled “The Great Pension Caper”, arguing against pension cuts.
The Chicago Teachers Pension Fund represents one of several retirement systems in the city of Chicago. Other retirement systems include the Chicago Transit Authority Fund, the Cook County Employees’ Pension Fund, the Firemen’s Annuity and Benefit Fund of Chicago, the Policemen’s Annuity and Benefit Fund of Chicago, in addition to several other municipal employee funds. According to the Commission on Government Forecasting and Accountability, the Chicago Teachers Pension Fund has a 53.9 percent funded ratio. But, even as the funded ratio dropped from 78 percent in 2006 to 54 percent funded in 2012, the average teacher retirement benefit increased from $37,241 in 2006 to $46,440 in 2012. Chicago is paying more in pensions benefits while its funding ratio is dropping.
In order to be eligible for a pension, teachers must meet a minimum number of years of service or a vesting requirement before they receive rights to a pension. In the Chicago Public Schools, teachers employed before January 1, 2011 are required to work five years before becoming eligible for a minimum pension. These are called Tier 1 employees. Later the city increased the vesting period such that teachers employed on or after January 1, 2011 must serve 10 years before being eligible for a pension. These are called Tier 2 employees. In addition to changes in the vesting requirement, the retirement age increased for Tier 2 teachers. Where Tier 1 teachers can retire with full pension benefits at age 60 with at least 20 years of service (or age 62 with at least 5 years of service or age 55 with at least 33.95 years of service), Tier 2 teachers must wait to retire until age 67 with at least 10 years of service according to the Chicago Teachers' Pension Fund.
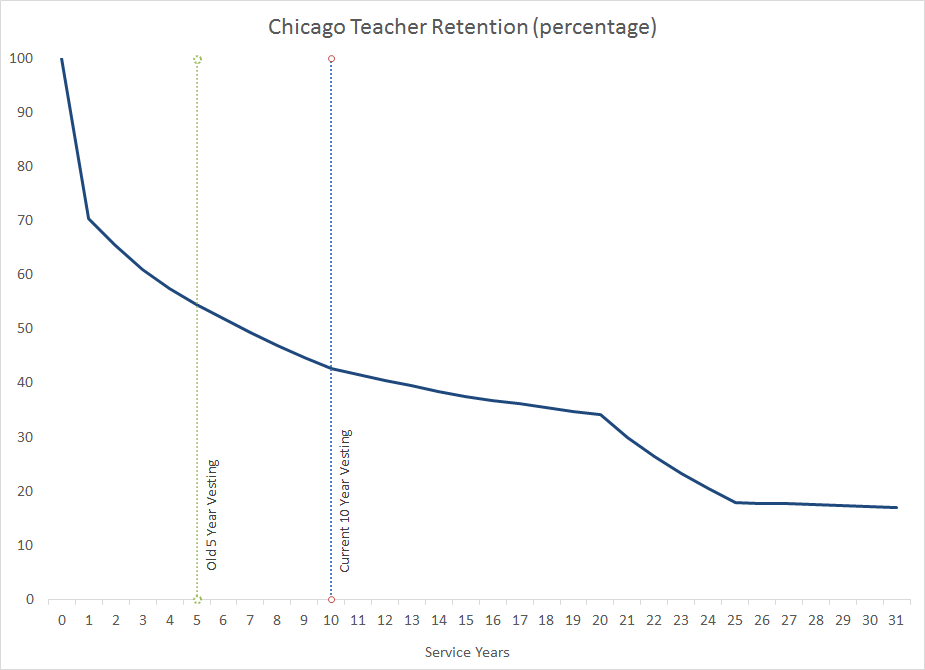
To better understand Chicago’s situation in relation to its teachers, take a look at some data from the city’s comprehensive financial report. The chart below shows the city’s assumed teacher retention rates for 25-year-old female teachers.
Source: Chicago Teachers’ Pension Fund Comprehensive Annual Financial Report 2012As shown in the graph, 45 percent of teachers leave after five years and 57 percent leave after 10 years. For Tier 1 teachers, the city assumes 55 percent will stay for five years and qualify for a minimum pension. For Tier 2 teachers, only 43 percent will stay the full 10 years and qualify for a pension.
Because Illinois is one of a cluster of states that excludes teachers from receiving Social Security, Chicago Public Schools teachers do not receive Social Security benefits. In other words, a teacher hired after 2011 could work up to nine years in Chicago without any form of retirement benefit, pension or Social Security. These teachers have evaded the attention of the media as well as lawmakers, and instead quietly leave without any employer-provided retirement savings.
The retention percentages drop even further as time progresses and few teachers reach eligibility for full retirement benefits. The percentage of teachers who teach beyond 25 years plateaus at 17 percent. Under Tier 1 requirements, a teacher beginning at age 25 with a total service of 34 years can retire at age 58 (Tier 1 requires a teacher retiring at age 55 to have a rather unusual retirement requirement of 33.95 years of service to receive unreduced pension benefits). This means that approximately 83 percent of teachers who began their careers at age 25 under Tier 1 requirements will not stay in the profession long enough to reach eligibility for full pension benefits. The Tier 2 changes increase the retirement age to age 67 but with a minimum of ten years of service. This creates an odd set of incentive for teachers, making it more difficult for early career teachers to receive a pension while granting full pension benefits for later career changers. A teacher beginning at age 25 cannot retire any earlier than age 67 and therefore would need to serve a minimum of 43 years to reach eligibility, otherwise she will face reductions in her pension. On the other hand, a teacher who begins teaching at age 58 could presumably teach for 10 years and retire with full benefits at age 67.
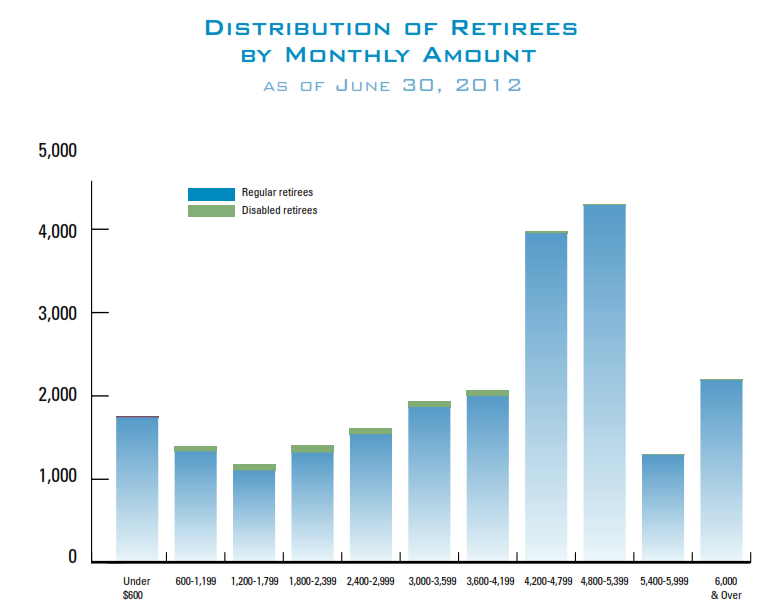
The next graph shows the distribution of retirement benefits for teachers who qualify for a pension.
Source: Chicago Teachers’ Pension Fund Comprehensive Annual Financial Report 2012
As shown in the graph, the most frequent or common retirement benefit is $4,800-5,399 per month or $57,600-64788 a year. A minority of retirees receive monthly benefits of over $6,000 a month or $72,000 a year (some receiving over $100,000). Currently there are 36,926 retirees and beneficiaries who receive a combined total of $93,006,741 per month in benefits from the Chicago Teachers’ Fund. Multiply this amount over the course of a year, and this equates to over a billion dollars a year ($1,116,080,892). Not only are retirement benefits back-loaded such that only a small percentage of teachers benefit, these benefits come at an expensive price tag.
Rather than promoting a system where a small percentage of teachers receive the majority of retirement wealth and the other half nothing, Chicago can use this time of unrest to carefully consider its options for sustainable and equitable retirement reform.
*Note on January 7, 2014, Governor Pat Quinn signed into legislation to stabilize the pension liabilities for the Park Employees and Retirement Board Employees’ Annuity and Benefit Fund. The law affects employees of the Chicago Park District, and includes provisions to increase the retirement age and cut post-retirement benefits.
Taxonomy:Are teachers more likely to die or be dismissed for poor performance? It's a morbid question, but it is possible to determine the answer, and the answer says a lot about our priorities.
Recently, Katharine B. Stevens, a Ph.D. from Columbia University, published the results of an in-depth analysis of teacher dismissal procedures in New York City. She found:
Over the 10-year period I studied (1997-2007), just 12 of New York City teachers (of whom there are 75,000 at any given time) were dismissed for incompetent teaching. Teachers who had years of “unsatisfactory” ratings; who were proven over months of hearings to be grossly incompetent; who were verbally and physically abusive to children, parents and colleagues, or who simply failed to come to work for days and weeks on end were returned to classrooms.
That averages out to 1.2 New York City teachers dismissed for poor performance each year. With 75,000 teachers, that equals an annual dismissal rate of 0.000016 percent.
How does this figure compare to teacher mortality rates? We can turn to the city's pension plan to find out. Defined benefit pension plans, such as New York City's, must estimate how long teachers will live in order to determine how long they'll receive benefits. They conduct regular "experience studies" to see how their estimates stack up against actual outcomes in order to have confidence that the numbers they use are accurate. The city publishes its estimates for mortality rates in Table 2 of the pension plan's annual report. The mortality rates range from 0.02 percent for 20-year-old female teachers up to 0.32 percent for 65-year-old males. New York City teachers have a median age of 40 and 75 percent of them are female, so that's the best point of comparison. That rate is 0.03 percent. At that rate, the pension plan is assuming that 22.5 active New York City teachers will die every year.
Many of these teachers are in the prime of their lives, so thankfully death is quite uncommon. But the fact that New York City teachers are 18.75 times more likely to die than they are to be dismissed for poor performance suggests something broken about the dismissal process. These figures give us a sense of just how difficult it is to remove poor performing teachers.
Assumptions are a key component of any pension plan. Pension plans make assumptions about future rates of retirement, withdrawal, salary, mortality, in addition to other characteristics about the retiree pool. To ensure the accuracy of these assumptions, state retirement systems conduct regular “experience studies” to compare their assumptions with data about the actual numbers observed on the ground. Experience studies help ensure the accuracy of a plan by measuring any fluctuations in the field and proposing subsequent adjustments to plan assumptions.
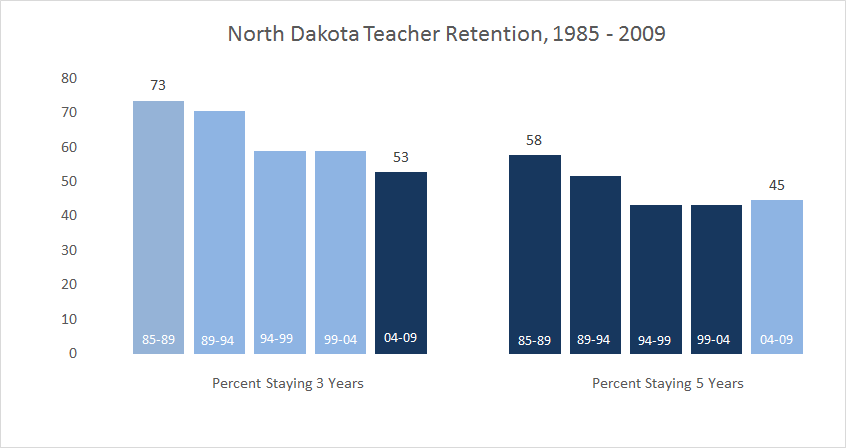
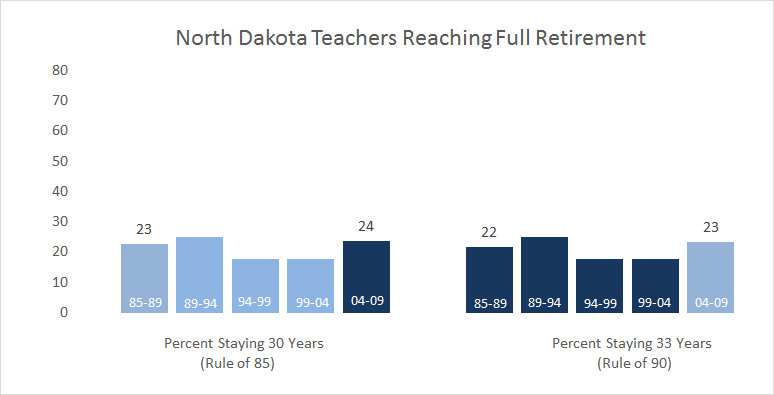
We unearthed over two decades worth of experience studies from the North Dakota Teachers’ Fund for Retirement (TFFR).North Dakota, like most states, offers a traditional defined benefit public pension plan. Under the defined benefit plan, teachers receive a pension based on the number of years taught, final year salary, and a multiplier. In order to be eligible for a pension, teachers must meet a minimum number of years of service or a vesting requirement before they receive rights to a pension. In North Dakota teachers employed before July 1, 2008 were required to work three years before becoming eligible for a minimal pension. This is called the “vesting” requirement. Teachers employed on or after July 1, 2008 must serve five years before being eligible for a pension. Most states have either a five- or ten-year vesting period.Below is a chart tracking the changes over time of 25-year-old female teachers who qualify for at least a minimal pension benefit. The data comes from experience studies issued by the North Dakota Teachers’ Retirement Fund over nearly 25 years.Source: North Dakota Teachers’ Fund for Retirement Experience Study Reports, 1985 -2009The chart shows that North Dakota teacher retention has declined for early-career teachers over the last twenty five years. More teachers are either leaving the profession or moving outside of North Dakota. Where 73 percent teachers stayed in the classroom for three years during the 1980s, by the 2000s roughly half of teachers remained. Similarly, the five-year retention rate dropped from 58 percent to 45 percent.The light blue bars highlight North Dakota's vesting requirement for teachers to earn a minimal pension benefit. Over the course of this period, North Dakota actually made it harder to qualify for a pension by lengthening its vesting requirement from three years to five. Combined with the rising attrition rate, the percentage of teachers who earn a pension in North Dakota has fallen from 73 percent in the late 1980s to only 45 percent today.The next graph shows the other end of the spectrum, the percentage of teachers who will stay teaching in North Dakota for a full career and reach the "normal" retirement age set by the state.Source: North Dakota Teachers’ Fund for Retirement Experience Study Reports, 1985 -2009Under North Dakota’s pension rules, the normal retirement age is 65. Teachers hired before July 1, 2008 can also qualify for full retirements before age 65 under what is called the “Rule of 85.” That is, a teacher can receive full retirement benefits if her age plus service years equals 85. Hence, someone who begins teaching at age 25 is eligible to retire at age 55 when she has accumulated 30 years of service (55 + 30 = 85). Teachers hired after July 1, 2008 can retire with an unreduced benefit under the "Rule of 90." Using the same math as before, a teacher who starts at age 25 now must wait to retire until she reaches at least age 58, when she has 33 years of experience (58 + 33 > 90). In other words, North Dakota not only made it harder to qualify for a minimal pension benefit, they also made it harder to earn a full, unreduced benefit.That change means fewer teachers will qualify. In the 1980s and 90s, just under a quarter of North Dakota teachers remained long enough to receive full retirement benefits. These teachers stayed in the system long enough to not only meet initial vesting requirements, but also accumulated enough service years to actually receive an unreduced pension. Now, with the longer requirement, only 23 percent qualify. North Dakota's policies have created a smaller pool of winners and many more losers.North Dakota is currently ranked as the fastest growing economy in the U.S. Home to a booming oil industry, North Dakota now boasts a GDP that is 29 percent over the national average, according to the U.S. Energy Information Administration. Just last spring the North Dakota legislature approved over $2.1 billion for the state K-12 education budget to cover education costs for its growing population. But at the same time, the North Dakota pension plan is only 60.9 percent funded, which places it amongst the twenty most underfunded pensions. Policymakers should take note of the large mismatch between the state’s booming economy and its struggling teacher pension system.Traditional defined benefit pension plans are unique in that they require budgeting for long-term costs. Present-day conditions can make those plans look either better- or worse-off than they really are, forcing strong reactions from policymakers. For teacher pensions, this can force school districts to pay large and unexpected costs.
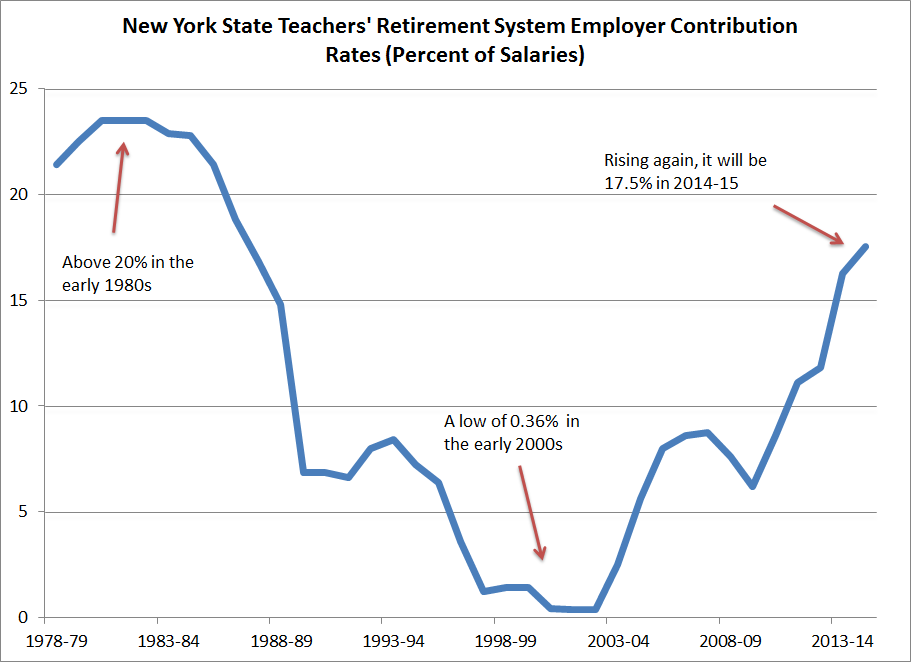
New York provides an excellent example of how these fluctuations happen. Last week the New York State Teachers' Retirement System (NYSTRS), which provides a defined benefit pension plan to public school teachers and administrators outside of New York City, announced it was raising the required employer contribution rate* from 16.25 to 17.53 percent of payroll.
To put New York's 17.53 percent rate in historical context, I created the chart below to show the considerable peaks and valleys the employer contribution rate has reached over time. In the late 1970s and early 1980s, school districts contributed more than 20 percent of teacher salaries into the state defined benefit pension plan. That rate declined for much of the next two decades, and, following strong returns in the stock market of the late 1990s, the rate hit a low of 0.36 percent (!) in 2001-2 and 2002-3. Two recessions later, the required employer contribution rate will climb to 17.5 percent next year.
Districts could offer more predictable retirement benefits. Consider that New York's 17.5 percent rate will be about 7 percentage points higher than what comparable workers in the private sector receive for their retirement. For the entire NYSTRS system, the average employer contribution rate over the last 37 years has been 10.9 percent. If New York school districts had a stable 10.9 percent contribution rate, their budgets would look a lot different. For example, the Buffalo Public Schools budgeted slightly more than $160 billion in teacher salaries for the 2012-13 school year. Assuming the same budget totals in 2014-15, Buffalo will be forced to pay $28.1 million in teacher pension costs. If, instead, the city contributed only 10.9 percent into employee retirement, Buffalo would reduce spending on teacher pensions to $17.5 million. If given a choice, Buffalo could have used that $10.6 million difference to give each of its 2,822 teachers a base salary raise of $3,756, or it could have employed 187 more teachers.
Unfortunately, districts have no choice in these decisions. NYSTRS sets the mandatory contribution rates 16 months in advance in order to allow some time for planning, but district contributions are deducted automatically from their state aid for schools. Districts have no say in the contribution rates, and they can't negotiate the rates with their teachers' union. If teachers wanted a different allocation between salaries and retirement benefits--if, for example, they wanted higher salaries in exchange for less-generous pensions--they would have no way to accomplish it at the local level. The unpredictable nature of pension contibutions has a real consequence on school district budgets and, therefore, on teachers.
*NYSTRS determines an annual employer contribution rate based on how well the plan is funded. If the system has enough money to cover benefits in the future, it's considered well-funded and the plan would set a low contribution rate. If the plan has less than it needs to pay future benefits, it must save more money today in order to pay benefits in the future. Employees also contribute to the fund; depending on when they joined, most members contribute between 3 and 6 percent of their salary. Nearly every state has increased employer and/or employee contributions in recent years.
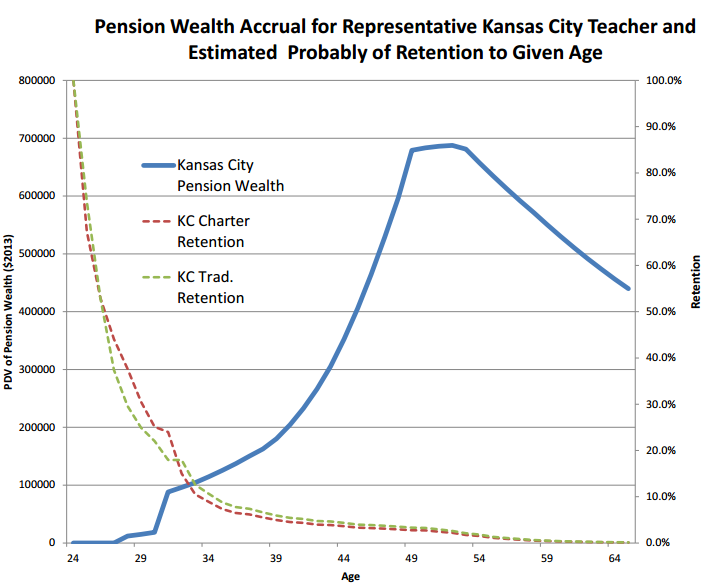
Taxonomy:In late January, the National Center for the Analysis of Longitudinal Data in Education Research (CALDER) held its Seventh Annual Research Conference. A session on teacher pensions featured a presentation from Cory Koedel, Shawn Ni, Michael Podgursky, and P. Brett Xiang analyzing how well defined benefit pension plans serve urban and charter school teachers in Missouri. In two simple graphs, the authors show that current teachers are poorly served by the existing defined benefit pension plan.
Two of their graphs, reproduced below, compare teacher retention rates (the dotted lines) in traditional and public charter schools with pension wealth accrual (the solid blue line). Here's what the situation looks like in Kansas City:
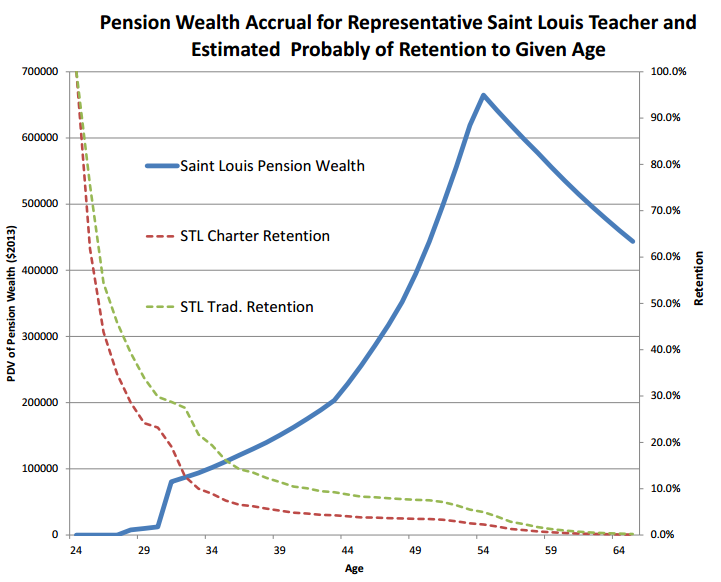
And here's the same graph for St. Louis teachers:
As you can see, both cities have high teacher turnover rates in both of their traditional and public charter schools. In both cities and sectors, more than half of all new teachers are gone within five years. Only about 10 percent of teachers make it to ten years.
Those are very high turnover rates, which is obviously a problem for the cities, their schools, and the students. But the teachers themselves are losing out as well. Kansas City and St. Louis may be extreme examples, but the situation is similar in cities and states all across the country. Defined benefit plans offer very little to early-career workers, jump in value a bit when employees "vest" into the system and qualify for a minimum pension, and then increase steeply as employees near retirement. (Pension wealth actually declines if employees choose to continue working after becoming eligible for retirement, because every year they keep working is a year they could instead be receiving retirement benefits.)
But what these graphs illustrate is just how few teachers are actually benefitting from the current pension system. The majority of teachers do not remain long enough to qualify for even a minimal pension, and only a very tiny fraction of teachers stay long enough to receive a pension that would be sufficient for a stable retirement. The Kansas City and St. Louis teacher pension plans are set up for a workforce that doesn't exist.
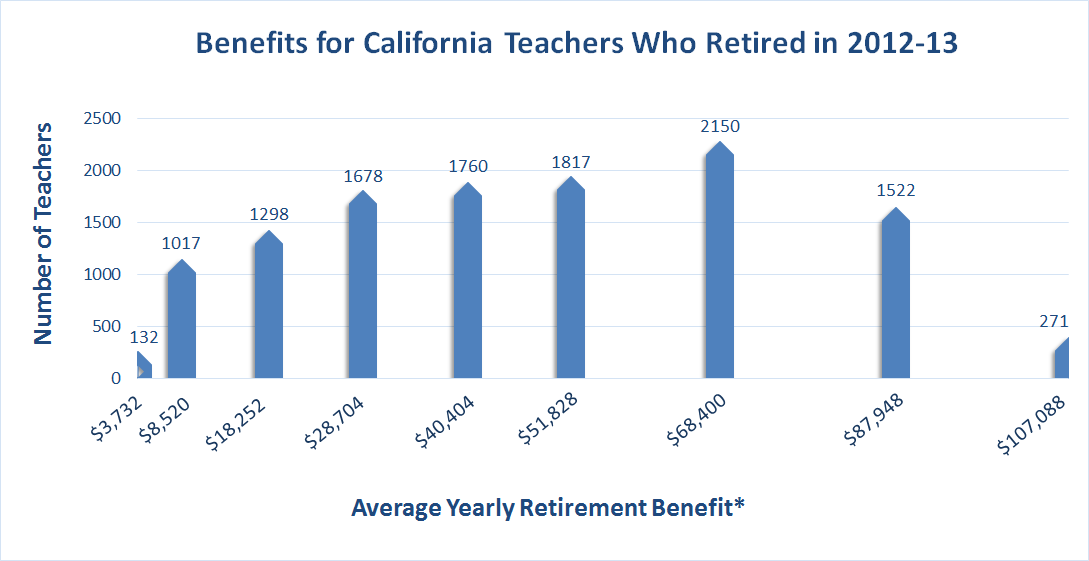
- Media sources often cite the average teacher pension, using it as a pivotal talking point for showing benefits as either overly generous or overly stingy. However, as Chad Aldeman discussed in a previous blog post, averages can be deceptive. The average often includes outliers on both extremes, creating a narrow picture of the pension distribution.California is an example of where the numbers and language can get jumbled and requires a more discerning eye. Hotly discussed in the media, the California Teachers’ Retirement System (CalSTRS) represents the second largest public retirement system in the country and has a $70 billion unfunded liability. Media outlets have struggled to accurately define the size of teacher pension benefits. According to the California Teachers Association, the average monthly pension is $3,300, or $39,600 a year. However, reading CNN, the average teacher salary in California is $68,000 a year. Ask the Los Angeles Times and we get the average teacher retiring with $48,000. How did we get this variety of numbers?To start, we should parse the language. The word “average”, or the statistical mean, mathematically denotes the sum total amount divided by the total number of observations. But often this word becomes conflated conceptually with what is actually the mode, or most frequent or most common occurrence. Furthermore, because of high or low outliers in pension benefits, there is often a wide disparity between the average and the mode. This is all a simple reminder in basic statistics, but these words easily get mixed together and subsequently skew the public’s perception of the actual distribution.Let’s take a look at the numbers cited from CalSTRS’ 2013 Comprehensive Annual Financial Report. In 2012-13, 11,645 teachers entered into retirement. The statistical average, or mean, annual teacher pension in California in 2013 was roughly $47,000. This number takes the total sum payout in retirement benefits divided by the total number of retirees receiving a benefit.However, this does not tell us how common or frequent this pension benefit was for retiring teachers. The number of service years for each of these teachers varies and, subsequently, so do their pensions. Where a retiring teacher who served for only 0-5 years receives a monthly pension of $311 (or $3,732 annually), a teacher who served forty or more years receives a monthly pension of $8,924 ($107,088 annually). This leaves us with a very wide scale where some teachers receive as little as $3,000 and others almost $110,000. The actual number of teachers who receive these amounts also differs greatly. Grouping teachers by set pension amounts (determined by the teacher’s service years), we can see the distribution of teachers and the pensions they receive:
Source: CalSTRS’ 2013 Comprehensivealifornia Annual Financial Report
Looking at the low and high ends of the pension spectrum, we see that there are indeed outliers with only 132 retirees receiving a $3000 pension and 271 retirees who received a $110,000 pension. The most frequently occurring pension amount was $68,400 with 2,150 retiring teachers, or 18 percent of all teachers who retired in 2013.
In other words, an “average” hides many nuances. Just because the average retiring teacher pension is a certain amount does not mean the typical retiring teacher actually receives this pension amount. Keep an astute eye and be cognizant of how colloquial meanings differ from the actual numbers.*The Average Yearly Retirement Benefit represents the statistical average of what teachers who served a particular range of service years received. For example, teachers who served 0-5 years received an average yearly retirement benefit of $3,732. Teachers who served 5-10 years received an average yearly retirement benefit of $8,520. Teachers who served 10-15 years received an average yearly retirement benefit of $18,252. The Average Yearly Retirement Benefit is calculated according to a benefit multiplier times the teacher's service years times his or her final salary.