There's a common, widespread belief that the shift from defined benefit pension plans to defined contribution plans in the private sector led to a decline in retirement savings. This is a myth. In fact, there were no "good ol' days" of retirement saving.
The myth starts simply enough. It's certainly true that private companies made a dramatic shift in the 1980's and 90's away from pension plans and toward 401k-style defined contribution plans. It's also true that, historically, pension plans were better investors than individuals (although that edge is diminishing).
It's also temping to conclude that our awful saving habits must have been caused by something. This is a trap that Dana Goldstein fell into last week. In a column for Vice, she concluded that, "the shift away from pensions has decimated Americans' retirement security." Her evidence for this claim is a link to a Guardian article showing that many people have 401k account balances worth less than $100,000. This is, indeed, not a very good outcome.
But what Goldstein misses (and she's far from alone in making this claim) is a smoking gun of causality. It turns out that we've NEVER been good at saving for retirement, and Ye Olde Private Pension Plans plans weren't that great either. It's easy to forget now, but a rash of high-profile bankruptcies and rampant misconduct in the private sector led to the passage of the Employee Retirement Income Security Act (ERISA) in 1974, a law that mandated protections for workers and created the Pension Benefit Guaranty Corporation (PBGC) to ensure that workers received some retirement income when their former employers went bankrupt. (We still have no equivalent protections in the public sector.) Ironically, ERISA itself is often blamed for the shift away from pension plans, even though it was seeking to clean up some of the worst offenses.
But even beyond high-profile failures, private-sector pensions were not providing retirement security to the masses. Like public-sector plans today but to an even greater extent, they were back-loaded and required workers to stay for very long periods of time. And without any federal protections, they often featured very long vesting periods of 10 or 20 years before a worker could qualify for a pension.
Most workers did not qualify for a pension at all, and there were large disparities by income. In 1980-81, before the mass exodus away from pension plans, only 27 percent of new retirees qualified for a private-sector pension. Only 3 percent of workers in the lowest-poverty quartile received a private pension, compared to 51 percent among the wealthiest quartile.
These numbers have not changed much over time. Among Baby Boomers retiring today--who would be the most likely group to have a pension--the typical retiree cannot rely on a private pension as the sole source of retirement security. Among retirees in 2012 aged 65 or older, only 26.8 percent received a private pension or annuity, and large gaps across income levels remain. (Paragraph updated on 4/18.)
So while it's tempting to look for blame as to why Americans are bad savers, the truth is private-sector pensions were never providing retirement security to the masses.
This is even more evident when you look at the issue on a historical basis. The graph below comes from the Boston College Center for Retirement Research. It shows the ratio of wealth to income by age across the last three decades. Each colored line represents one year, a snapshot in time. If the death of defined benefit pensions were really the cause of poor saving habits, we should expect to see a steady decline from the earlier years to the later years as more corporations abandoned their pension plans. But that's not what shows up at all. Instead it looks mostly like a jumble, with the year 2007 looking pretty good (when the stock market and housing prices were both at high points) and 2010 and 2013 being slightly lower than the rest (after one of the largest stock and housing market declines of all time). The rest all look pretty much the same.
From a retirement perspective, the percentage of workers participating in an employer-provided retirement plan has held relatively constant for decades, and total retirement wealth has also remained steady despite the move to DC plans. Another report from the Boston College Center looked at this DB-versus-DC question head-on. It showed a clear decline in wealth from defined benefit pension plans, but an equal increase in wealth from DC plans. On balance, the two canceled each other out, and the report found that, "the accumulation of retirement assets has not declined as a result of the shift from defined benefit to defined contribution plans." In regards to the common perception that the shift to DC plans harmed retirement saving, the Boston College researchers concluded that, "We are going to have to change our story!"
None of this is to say that we should be sanguine about the current state of retirement security in this country. We should continue to bolster the safety net to ensure all workers have access to a secure, comfortable retirement. Defined benefit pension plans never met those goals, however, and mourning their passage is longing for a bygone era that never existed.
Taxonomy:I’ll be in Chicago later today to speak on a panel about the city’s pension crisis. Meanwhile, Chicago schools will be closed tomorrow for the second teacher strike in the last four years.
These two events are related. In fact, the numbers behind Chicago’s teacher pension system are staggeringly, mind-blowingly awful. Here are a few highlights (or lowlights, depending on your perspective):
- 2 cents: The amount teachers contribute into the pension plan for every $1 they earn in salary.
- 7 cents: Called a pension “pick-up,” the city of Chicago pays 7 cents of each teacher’s so-called “employee” contribution (a total of 9 percent). The city and the union agreed to this deal in the 1980s and it has been common practice ever since.
- 32 cents: The additional amount Chicago is paying into the teacher pension fund for every $1 they pay in salaries. (Most of this is for debt.)
- $53 million: The amount Chicago contributed to the pension fund in 2006.
- $328 million: The amount Chicago’s actuaries said it was supposed to contribute in 2006.
- $635 million: The amount Chicago contributed to the pension fund in 2015.
- $750 million: The amount Chicago’s actuaries said it was supposed to contribute in 2015.
- $127 million: The amount of money the district spent on the pension pick-up last year. Chicago Public Schools is now bargaining to end the pick-up, a proposal that’s at the heart of the current strike (it would mean an immediate 7 percent cut in every teacher’s take-home pay).
- $800 million: The budget deficit the district faces next year, even after slashing school budgets in the midst of this year.
- 2059: The year in which Chicago hopes its pension fund will reach 90 percent funded (Note: the city does not currently expect to reach 100 percent funding ever). To even meet the 2059 goal, the city must annually contribute the full amount the actuaries say it needs (which the city has not done in recent years). The city must also be perfectly accurate in all of its assumptions, including earning annual investment returns of 7.75 percent.
If these numbers aren't depressing enough, here's one last number:
- 21 years: The length of time a new, 25-year-old Chicago teacher must remain teaching before her pension will finally be worth more than her own contributions. The vast majority of teachers will leave before then. Chicago teachers are in a different pension plan than other Illinois teachers, but these numbers are comparable to the state system.
As is true for the state as a whole, Chicago is spending a lot of money to preserve a pension plan that isn’t serving its teachers very well.
Taxonomy:How many teachers should be eligible for adequate retirement benefits?
My answer is all of them: For every year they work, teachers should accumulate benefits toward a secure retirement.
A reasonable person might say only those who stay for at least three or five years. That would require teachers to show some amount of commitment to the profession, and it would reward teachers for getting through the most challenging early years.
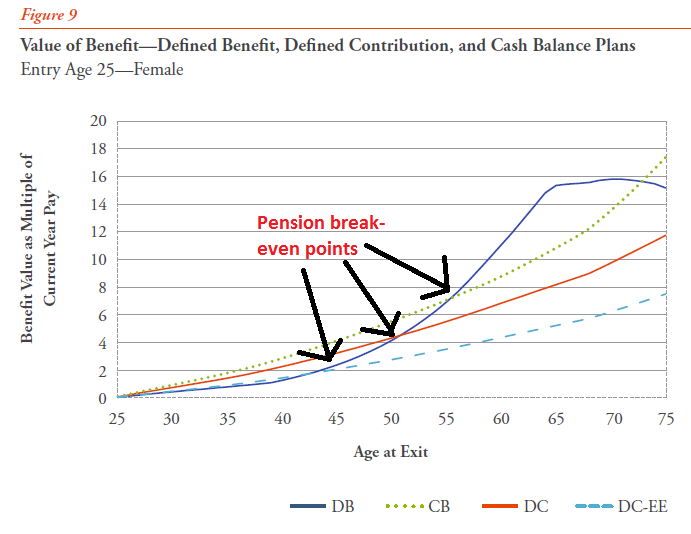
But that’s not the way current teacher retirement systems are designed. Most states require teachers to stay 20, 25, or even 30 years before they qualify for adequate retirement benefits. (The Urban Institute’s Rich Johnson and I calculated these “break-even” points across the country. Find info on your particular state here.)
In other words, today’s teacher pension systems only provide adequate benefits to teachers with extreme longevity. You don’t have to take my word for it. The California State Teachers' Retirement System (CalSTRS) hired Nari Rhee and William B. Fornia to study whether California teachers were better off under the existing pension system or alternative retirement plans.
The chart below comes directly from their paper. It shows how benefits accumulate for newly hired, 25-year-old females under the current pension system (blue line), a defined contribution plan (red line), a defined contribution plan with no employer contributions (dotted blue line), and a cash balance plan (dotted green line). There are legitimate questions about whether these are perfectly fair comparisons—Rhee and Fornia ignore the large debts accumulated under traditional pension plans—but even in this analysis, it’s clear that the pension system is the most back-loaded benefit structure. Some teachers do better under this arrangement, but most don't. Depending on the comparison, this group of teachers must stay two or three decades before the pension system offers a better deal.
Rhee and Fornia make a valid point that not all teachers enter the profession at age 25, and their paper also includes the graph below showing the actual distribution of California teachers by the age at which they began teaching. The most common entry ages are 23 and 24, just after candidates complete college (California requires most new teachers to go through a Master’s program before earning a license). The median entry age for current teachers is 29 (meaning half of all teachers enter at age 29 or younger), and the average is 33.
Rhee and Fornia’s point here is that people who begin teaching at older ages have shorter break-even points, and that teachers with shorter break-even points are more likely to benefit. This has a kernel of truth but obscures some key points.
First, it is true pension plans are better for workers who begin their careers at later ages. Pensions are based on a worker’s salary when she leaves the profession, and they don’t adjust for inflation during the interim. If a 35-year-old leaves teaching this year, she may qualify for a pension, but it will be based on her current salary right now. By the time she finally becomes eligible to begin drawing her pension, say in the year 2046, every $1 in pension wealth will be worth far less than it is today. Teachers who go straight from teaching into retirement don’t have this problem.
Consequently, it’s also true that teachers who begin their careers at later ages are comparatively better off than teachers who began at younger ages. They don’t have to wait as long, so the break-even points fall from 31 years for a 25-year-old entrant to just 7 years for a 45-year-old entrant.
But their argument starts to suffer when compared to teacher mobility patterns. Like other states, California sees much higher turnover in early-career teachers than mid- or late-career teachers. The result is that, even for a 45-year-old teacher with a relatively short break-even period of 7 years, only about half will actually reach that point.
The table below pulls together these two data points for teachers of various ages. The middle row illustrates how long the teacher would be required to stay until her pension would finally be worth more than a cash balance plan (Rhee and Fornia calculate slightly shorter break-even points for their defined contribution plans). The last column uses the state’s turnover assumptions to estimate how many California teachers will remain long enough to break even. Remember, the median teacher in California began teaching at age 29. The table below suggests this typical teacher would have had a break-even point of more than 25 years, and the state assumes that only 40.6 percent of this group of teachers will make it that far. Across the entire workforce, the majority of California teachers would be better off in a cash balance plan than the state’s current pension plan.
Age at which the teacher begins teaching
How many years does it take for the teacher to break even on her pension plan?
What percentage of teachers like her will break even?
25
31
34.6
30
25
40.6
35
19
43.7
40
13
46.6
45
7
54.2
California is a bit of an outlier here compared to other states—it’s a big state and seems to have lower teacher turnover than other states—but it’s still worth asking if this system is working well enough for all teachers. Rhee and Fornia's main point seems to be that, once you exclude short- and medium-term workers, the remaining teachers tend to do pretty well under the current system. But that excludes lots of people!
I personally don’t think that’s the right way to look at things. I think it’s worth fighting for retirement systems that treat ALL teachers fairly and equitably. After all, teachers might not know how long they’ll stay in the profession. They might not like teaching as much as they thought, or life might take them on another path. And once we account for this uncertainty, the break-even points become less about raw numbers (do I have to stay 19 or 22 years?) and more about probability (what’s my realistic chance of teaching in this state for 31 years?). Looked at from that perspective, it becomes harder and harder to support pension systems with such extreme back-loading.
Last week, Chad Aldeman and I attended the annual Association of Education Finance and Policy (AEFP) conference in Denver where we shared our latest research on inequities inherent in teacher pension plans. Below are descriptions of selected slides from our presentation:
Our work starts with the premise that teacher salaries are often unequal across cities and schools. Wealthier communities will likely offer higher salaries than poorer ones. Wealthier districts may then be able to attract and retain more experienced teachers. Since teachers are distributed inequitably across states and within districts, our hypothesis is that pensions exacerbate these inequities.
Pension benefits are based on a formula consisting of a plan multiplier, the worker's salary, and their years of experience. The formula literally multiplies these factors together. If the factors themselves--salary and experience--are unequal, then the pension benefits will amplify those inequities.
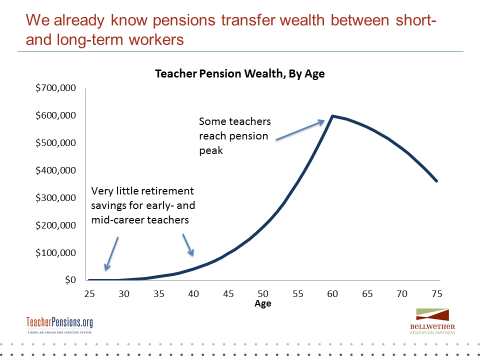
Moreover, we know that pension systems are inequitable in other ways. Traditional pensions accrue wealth unevenly, beginning relatively low during the early years of service and rapidly accruing benefits at the back end after 25 or more years of experience. The majority of teachers will end up with minimal or no benefits, and the system depends upon these teachers to subsidize the benefits of workers with full-career benefits.
To test our hypothesis, we examined a dataset comprised of every educator in the state of Illinois. The dataset allows us to look at characteristics of Illinois’ educator workforce in 2012, including variables such as an educator’s salary, in-state experience level, and district experience.
Our findings are still preliminary at this point, but they suggest that teachers are unevenly distributed across the state, and that pensions magnify inequities according to salary and experience level. Not only do poor communities have lower-paid, less-experienced teachers, they're also receiving less from state pension plans. When we cut the state’s districts into five poverty quintiles, we found that educators in the state’s richest districts often had higher salaries, experience levels, and subsequently, pension benefits. Additionally, other variables, such as who contributes to the plan and how much can, increase inequity. In Illinois, districts only pay a small portion of their workers’ contribution and the state picks up the remainder. Here, too, richer districts are getting a subsidy from all state taxpayers.
Stay tuned in the upcoming month as we finalize our research. To learn more about pensions the teaching workforce, check out our past publications.
America’s next president may bring substantial changes to Social Security, depending on who is elected. Both Republican and Democratic candidates have presented their ideas for change (or no change) at the last few debates. Current positions primarily focus on expansion or reduction, but so far haven’t mentioned workers who lack coverage.
So what do the 2016 presidential candidates want to do to Social Security?
Democrats
- Hillary Clinton says she will preserve benefits and enhance certain aspects of the program, such as benefits for vulnerable populations. She proposes lifting the payroll tax cap, broadening the tax base, and raising survivor benefits for groups such as widows and giving caregiver credits for those who have removed themselves from the workforce to care for children or ailing family members.
- Bernie Sanders proposes a broader expansion of the program with general increases to the minimum benefit and using a higher price index to make cost-of-living-adjustments (COLA) for more generous benefits. Similar to Clinton, Sanders also proposes lifting the current income cap, so that high-income individuals pay the same percentage on their income toward Social Security. Currently, high-income earners only need to pay Social Security taxes on a portion (the first $118,500) of their income. Sanders proposes lifting the cap, so that individual making over $250,000 will be taxed at the same percentage as other workers.
Republicans
- Ted Cruz says he will pass a general reduction of benefits for younger workers and would allow workers to invest a portion of their payroll taxes into a private account. Cruz would also raise the full retirement age and calculate initial benefits to match inflation rather than wage growth. Inflation typically grows slower than wages, so tying benefits to inflation would result in a lower benefits. Cruz says he will not institute these changes for those currently nearing retirement.
- John Kasich proposes reducing benefits for high-income workers while maintaining benefits for those who depend upon Social Security. Unlike Cruz and Rubio, he has not proposed raising the full retirement age.
- Marco Rubio intends to gradually raise the full retirement age for new workers, but not for workers nearing retirement, and reduce benefits for higher earners, while also increasing the current minimum benefit for low-income workers. Rubio also proposes eliminating the Social Security earnings test, a provision which withholds a portion of benefits for older workers who haven’t reached full retirement and make a certain threshold of income. While the earnings test does not reduce total benefits, and instead only delays benefits, many workers perceive the provision as a tax penalty. As a result, the earning test can deter older workers from working. In addition to these proposals, Rubio would also allow workers to participate in the Thrift Savings Plan, a defined contribution or 401k-type plan currently only available to federal workers.
- Donald Trump hasn’t proposed a specific plan on Social Security on his website at this time, but has verbally committed to no changes. In the last Republican debate in Miami, Trump says, “it is my absolute intention to leave Social Security the way it is. Not increase the age and to leave it as is.”
Note: For more information on candidate positions, see the Center for Retirement Research at Boston College and AARP.
Besides expansion or reduction, however, none of the candidates have considered extending coverage to uncovered workers—despite the potential appeal to both parties. Over 1 million teachers, and 6.5 million government workers hold jobs that aren’t covered by Social Security. Extending coverage to all these workers would seem like a natural complement to expansion of benefits for workers who are already covered. On the left, however, public sector unions remain staunchly opposed to mandatory coverage because these groups prefer a standalone pension benefit, which tend to be more generous to full-career workers than Social Security. But even the current candidates on the right have overlooked universal Social Security coverage, a move which would actually reduce the program’s deficit by more evenly distributing the program’s legacy costs.
Lack of coverage also has implications for state and local pension plans. Last week, my colleague Chad Aldeman, released a report that examines how IRS tax provisions allow states without full Social Security coverage to maintain outdated state pension plans.
As the primary turns to the general election season, candidates will need to start considering the complete picture around Social Security and retirement.
Illinois’ $111 billion unpaid pension debt--over half of which is due to teachers--has prompted talk over a federal bailout. Illinois policymakers continue debating fixes without any real long-term solutions, let alone a budget.
But the $58 billion question remains: how well are Illinois teacher pensions actually serving its workers?
Unfortunately, not that well. Despite its high price tag, Illinois’ teacher retirement plan is doing a poor job of serving the majority of its teachers.
Last week, Chad Aldeman, Daniel Fuchs, and I released a report that examines the benefit structure for Illinois’ teachers. New teachers, in particular, face substantially lower retirement benefits than teachers hired before the recession. In 2011, in response to worsening financial conditions, the state legislature created a less generous plan for new teachers called “Tier II.” Tier II imposes on teachers a higher minimum service requirement (up from five to 10 years, making it more difficult for new teachers to qualify for a minimum benefit), a higher normal retirement age (meaning teachers have fewer retirement years to collect a pension), a less generous pension formula (calculating the final average salary from the last eight years of service instead of just four), and a lower, uncompounded cost-of-living adjustment (COLA).
The graph below compares Tier II benefits for new teachers to the prior Tier II plan. Notice how the red line dips negative for the first two and half decades of a new teacher’s service. This means that a 25-year old Illinois teacher hired after 2011 won't receive a net positive retirement benefit until she's worked at least 26 years. Until then, she’ll pay a penalty just to participate in the system.
Over three-quarters of new Illinois teachers are expected to end up with negative net benefits at retirement. High minimum service requirements and lack of Social Security compound these issues further. By switching to an alternative plan, such as a smooth accrual defined benefit or defined contribution plan, the state would ensure that all teachers come out with a net positive.
Read here for more about Illinois’ growing teacher pension problem and reform solutions.


