A couple weeks ago I joined a panel hosted by the Albert Shanker Institute and the American Federation of Teachers on the question of, "Is There a Pension Crisis?" I was joined on the panel by Teresa Ghilarducci, the Bernard L. and Irene Schwartz Chair in Economic Policy Analysis and director of the Schwartz Center for Economic Policy Analysis at The New School; David Cay Johnston, a professor of business, tax, and property law at Syracuse University College of Law and a former New York Times Pulitzer Prize-winning investigative reporter; and Dan Pedrotty, the manager for research and strategic initiatives department at the American Federation of Teachers.
My basic message was that a "crisis" is in the eye of the beholder, but teachers are paying the ultimate costs of our current system through lower base salaries and poor retirement security. I've uploaded a video of my presentation below:
To watch all all of the presentations and the Q and A or to download our PowerPoint files, please visit the Shanker Institute event page.
Taxonomy:Recently, the Chicago Tribune reported a story on a union lobbyist suing over recent pension benefit cuts. The catch? He only taught for one day as a substitute teacher in order to exploit a loophole in state law.
Under an obscure 2007 Illinois law, passed under former Governor Rod Blagojevich (yes, the one who was convicted and removed from office), union officials could participate in the Illinois Teachers’ Retirement System by teaching for a single day. Moreover, they could count their time with the Illinois Federation of Teachers toward a teacher pension. In response, two teacher union lobbyists, David Piccioli and Steven Preckwinkle each taught for a single day in Springfield, Illinois schools. (Who knows what, if anything, the two lobbyists taught their students in those two days.)
A one-day service requirement stands in sharp contrast to the 10 year minimum service requirement that Illinois legislators adopted for teachers in 2011. Any teacher hired on or after 2011 must serve 10 years in order to qualify for a minimum pension benefit. A teacher who teaches for 9 years just falls short, earning neither pension benefits nor Social Security for her time in the classroom. Heightening the absurdity, the lobbyists made substantively more in salary, the Tribune reported six figures each, than a typical public school teacher. And because pension formulas hinge on service time and final average salary, a higher salary will dramatically boost the pension benefit.
Later laws have since revoked the provision allowing union employee service credit to count toward a teacher pension. But both lobbyists have remained in the state teacher pension system, and Piccioli is now suing for his benefits.
In fact, if Piccioli wins, the state will be on the hook for paying even more in his retirement benefits for years, all for a single day of probably not great teaching. None of this is in the interest of schools, teachers, or students, and it stands in stark contrast to how the state is treating its full-time teachers.
Taxonomy:If you’re not a public employee, it’s easy to brush away pensions as matter only for state lawmakers and affected workers. But it should be a national priority to ensure that all state and local government workers, especially teachers, have adequate retirement savings.
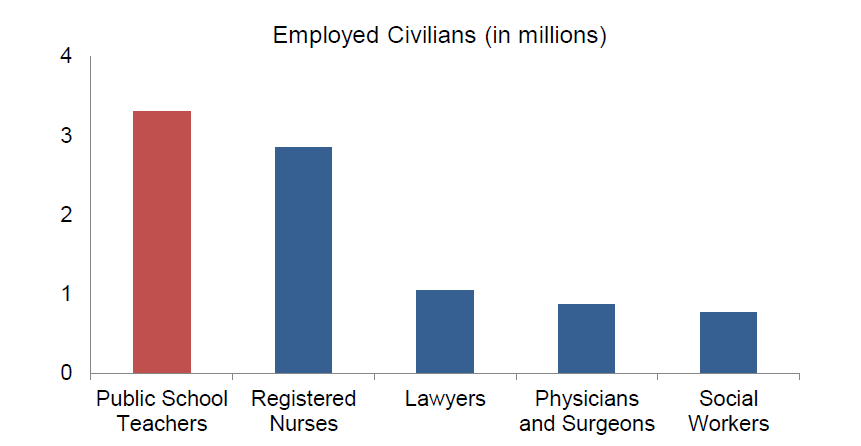
Even beyond the important role that teachers play in student lives and in the fabric of communities, there are simply a lot of them. Nationwide, there are 3.3 million public school teachers. Public school teachers are one of the largest professions in the U.S., and the largest class of workers with a college degree or higher. There are more public school teachers than lawyers, doctors, and retail salespersons, and there are as many teachers as nurses and social workers combined.
Source: Chad Aldeman and Andrew Rotherham, “Friends without Benefits,” Bellwether Education Partners, 2014. National Center for Education Statistics, “Fast Facts.” U.S. Bureau of Labor Statistics, “Employment and Earnings Online.” Diminish
And yet, current policies curtail the retirement security of this major class of workers. Current retirement systems don’t serve the majority of teachers, setting all-or-nothing service requirements of five or 10 years and offering minimal benefits during the first 20 years of service. In the median state, teachers need to work for a minimum of 24 years before their lifetime pension benefits are worth more than their own contributions plus interest.
On top of these equity issues, traditional pensions come at an expensive price. Tied to the teaching workforce is massive pension debt: Collectively, teacher pension debt accounts for $500 billion of all state pension debt. For every dollar states and local school districts are contributing to teacher pension plans, an average of $.70 goes toward paying down pension debt. Massive pension debt crowds out other education funding, and in some cities, has forced reductions in crucial, basic public services, or caused large tax increases.
Rather than continuing a system that inequitably and inefficiently distributes benefits, states need to consider ways to provide affordable retirement benefits that will put all teachers on a path to retirement security. Because what would be good for this large, important group of workers, would also benefit the rest of our nation.
Taxonomy:State and local governments around the country are waiting to see how the Illinois Supreme Court will rule on a contested pension reform law. We've previously posted a video by Sal Khan, the founder of Khan Academy, explaining pension obligations. Given the recent interest in Illinois' state pension plans, it's worth your time to watch this video explaining how Illinois became one of the worst funded states in the nation and the consequences for the state's education funding:
Taxonomy:- Everyone probably knows a teacher—whether a friend, family member, neighbor, or colleague—who’s waiting for the right year to retire. Most late-career teachers know they have a “magic year” they need to reach in order to receive optimal retirement benefits. This typically happens between ages 55 to 60, or after 30 plus years in the classroom, depending on the plan and when the teacher began teaching.But once teachers reach that special year, they know they need to get out. Otherwise, every year they don’t is a year they give up in retirement benefits. Even though staying beyond the set retirement year oftentimes means a bigger retirement check, because pensions are guaranteed over a lifetime, working when you could be retired means less checks to collect over a lifetime. And so working longer than needed still means giving up a substantial amount of money.Rather than discouraging work at older ages, states could enact policies that encourage workers to continue working for longer. An effective teacher who reaches her “magic year” of retirement doesn’t suddenly become ineffective upon reaching that year. Teachers who perform well and want to teach beyond the prescribed plan retirement age shouldn’t be punished. The teaching workforce could greatly benefit from the insights of veteran teachers or second-career teachers who switched to teaching at relatively older ages.For more on the “magic year” and how it impacts the teachers, read my new piece on RealClearEducation.Taxonomy:
Stock markets are hitting new highs (in nominal dollars) and pension plans have now earned positive returns in six straight years. But while this is good news, it's worth pausing a moment to note that by some measures the current stock market is as expensive as it has ever been. Past returns are no guarantee of future results, but pension plans should be concerned that one of the strongest and longest bull markets has not been sufficient to restore plan funding. The four graphs below help provide some historical perspective:
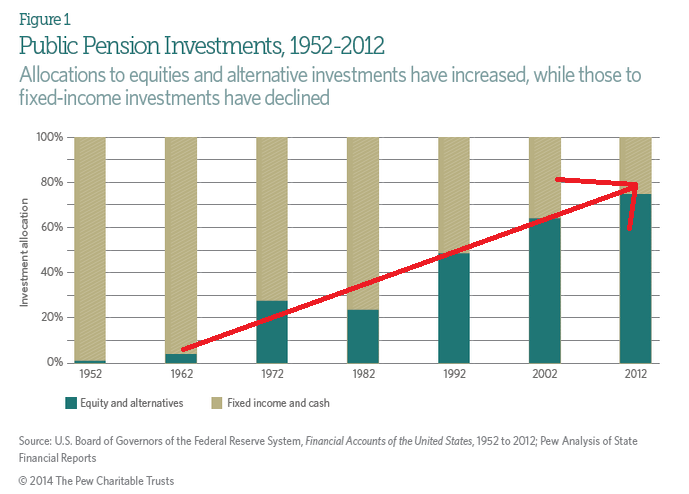
1. Pension plans didn't always take risks on stocks or private investments. The first graph, from the Pew Charitable Trusts, shows the rise in pension risk-taking. Starting in the 1970s and accelerating in the 1980s and 90s, pension plans invested higher and higher percentages of their assets in stocks (equity) and other alternative investments. This bet works well during bull markets but leaves pension plan funding levels much more vulnerable to bear market declines. On the positive side, it led pension plans to be fully funded by the end of the dot-com bubble but subsequently led them to crash twice in the last 15 years. But there is a steep downside--pension plans are more dependent on strong investment returns than ever before.
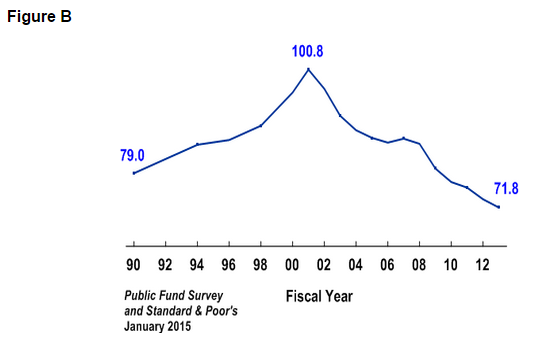
2. Pension funds have not rebounded from recent stock market crashes. The most recent data on large state and local public pension plans from the Public Fund Survey, a compendium of data on large state and local pension systems, suggests that pension plan funding levels are closely linked to stock market returns. After the aggregate funded ratio topped 100 percent in the early 2000s after the dot-com boom, benefit increases and two economic recessions caused a strong reversion. Today, even with recent stock market increases, pension plan funding levels haven't even begun to recover.
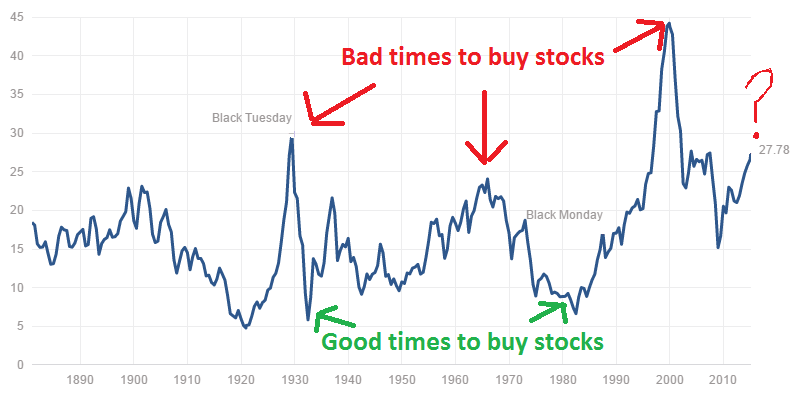
3. There are better and worse times to buy stocks. Now seems like a bad time. Pension plans assume 7.5 or 8 percent returns every year, but in reality stock markets tend to be uneven. While no one can confidently time the stock market, there are historical indicators of good and bad times to buy stocks. It was a bad time to buy in 1928 and 1929. The 1970s weren't a great decade for investors. And 1999 was a terrible time to buy stock, especially of technology companies. You may remember what happened to investments during the financial meltdown in 2007-9.
The chart below tracks a ratio known as the Shiller Cyclically Adjusted Price Earnings (CAPE) ratio. While the CAPE is not necessarily a strong predictor of short-term outcomes, it uses 10 years of inflation-adjusted earnings data to provide useful historical comparisons. On this average, market-wide, long-term basis, stocks are now more expensive than they were in 2007 and more expensive than any time other than 1929 or 1999.
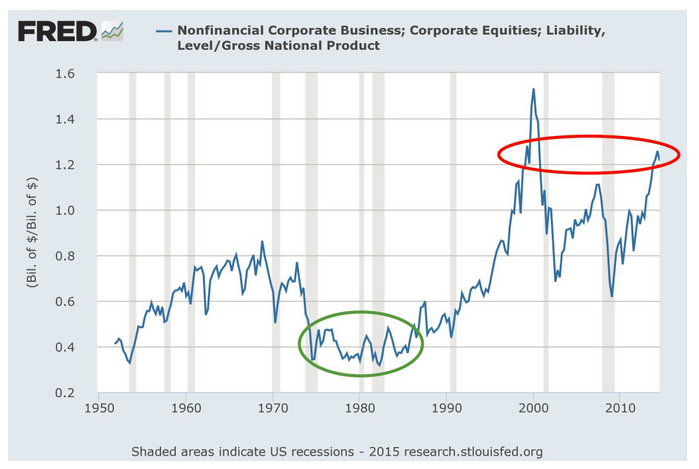
4. Stocks are now valued more than the entire U.S. Gross National Product. There are multiple ways to value the stock market. Legendary businessmen and investor Warren Buffett likes to use the total aggregate stock market capitalization divided by Gross National Product (or GDP). When this indicator rises above 1.0, it means investors are valuing the stock market more than the total goods and services produced within the country. We've only been above 1.0 three times--in the late 1990s, just before the 2007 meltdown, and today. Needless to say, the first two times were decidedly NOT good times to buy stocks.
The chart below shows the long-term trend of this indicator. The green circle represents a pretty good time to buy stocks. (Incidentally or not, this roughly lines up with when pension plans began investing more heavily in equity markets.) The red circle represents today's elevated levels. Again, this measure says little about where the stock market will go in the next few months or even years. That said, elevated levels on this indicator have historically been associated with poor returns in the future.
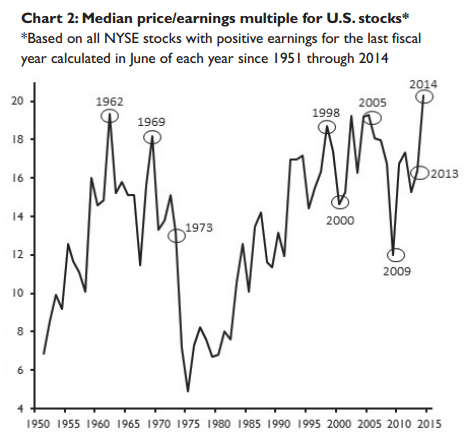
5. The median stock is more expensive than ever. As the NASDAQ index of technology stocks reaches its 2000-era peak, there have been a number of stories comparing the top companies from 15 years ago versus the top companies today. In short, many of the leading companies in 2000 had very small earnings, whereas today the index is led by extraordinarily profitable companies like Apple. That's an important point, except that we can't all just invest in the "best" companies. Markets are made up of a wide variety of companies, not just a few high-fliers. And even if you (or a pension plan) could accurately identify the best investments, these companies might be vulnerable if the entire market goes down.
So another way to look at market valuations is to consider the median stock, the company that sits right in the middle of the market. The graph below shows the price/ earnings ratio for the median stock listed on the New York Stock Exchange (NYSE) for every year from 1951 through 2014. On this measure, the market is actually more expensive than any time in the last 65 years. We're also at or near all-time highs for the median stock almost no matter what financial aspect you look at (in terms of assets or the amount of cash they bring in).
All of this should terrify pension plans (not to mention other investors). Now is probably not a good time to take on risky pension obligation bonds, reduce contribution rates, or expand benefits. Who knows when the next stock market crash will come or how steep it will be, but it is inevitable. Pension plans should be prepared.
Taxonomy: