The Louisiana Legislature recently agreed to a 1.5 percent cost-of-living adjustment (COLA), meaning that retirees will see a small boost in their pension payments.* In Louisiana, like most other states, cost-of-living adjustments are a way for state pension plans to offer retiree benefits that are adjusted for inflation and are usually determined by the state legislature. Louisiana previously linked their pension plan’s COLAs to just changes in the Consumer Price Index (CPI), but now also tie COLAs to investment gains so the amount they adjust for is subject to change according to the plan’s funding levels. COLAs, like pension benefits themselves, are entangled in the political process, and so retirees must rely on the legislature to get their benefits.
While the formulas used to determine public sector pensions have ironclad legal protections—protecting past and sometimes even future benefit accruals—COLAs face less scrutiny. The Center for Retirement Research reports that 17 states reduced, suspended, or eliminated their COLAs from 2010 to 2014. While most of the cuts were challenged, the courts upheld 10 of the 12 cuts (except in Illinois and New Jersey, where the case is still pending in a lower court but a COLA freeze remains).
But compared to the uncertainty around public pension COLAs, Social Security benefits automatically adjust for inflation. While debates rage on what measure of the CPI to use, the fact is that Social Security benefits are automatically adjusted each year. Unlike in state pension plans, workers don’t need to worry about the value of their Social Security benefits eroding over time. Today, six teacher pension plans offer COLAs less than the change in CPI (when it's positive) or have eliminated COLAs altogether. Another 12 teacher pension plans are left to the ad hoc decision-making of their state legislatures or are based on investment returns.
This is bad news for public workers who don’t participate in Social Security. Teachers in Louisiana may get a temporary win with their new COLA, but overall, they lose out because Louisiana teachers and other public sector workers aren’t covered by Social Security. Instead, they’ll have to hope that investment gains improve in order to see any further increases. Similarly, states with ad hoc increases will have to depend upon their legislatures to approve adequate adjustments from year to year. States without coverage historically banked on their pension systems to Social Security, but that wager carries more risk.
*Update: Governor Bobby Jindal vetoed the COLA bill, so Louisiana’s retirees will not receive an increase to their pensions. Instead, the 1.5 boost will go into effect next year, unless other legislative changes are made and/or funding levels and investment gains change.
Taxonomy:How many teachers retire each year? That may sound like an easy question to answer (especially for a website called TeacherPensions.org), but it's not quite so easy once you start digging into the numbers.
There's no national dataset that collects annual data on teacher retirements. The most recent data on retirement from National Center for Education Statistics' Schools and Staffing Survey (SASS) estimated that 269,800 teachers left the classroom in the 2008-9 school year and 27.8 percent of them retired. That gives us a total of 75,004 public school teachers who retired that year, or about 2.2 percent of the 3.4 million teachers nationwide.
But retirement rates can change. The state of the broader economy, changes in pension plan provisions, working conditions at schools, and personal factors all play a role in teacher retirement decisions. The 2004-5 SASS found that 39.2 percent of teachers who left the profession did so for retirement. That would put the national retirement rate in 2004-5 at 3.3 percent of all public school teachers. By these back-of-the-envelope calculations, the retirement rate of public school teachers seems to have fallen almost 50 percent from 2004-5 to the depths of the 2007-9 recession.
Another way to find an answer to this question is to look at data from state pension plans. Each year, some number of workers retire and begin receiving annual pension payments. The Boston College Center for Retirement Research has data going back more than a decade on the total number of these "annuitants" in each state pension plan. But those figures are a function of the number of new annuitants, minus any beneficiaries who pass away. They don't give us a perfectly accurate number of new retirees.
We can turn to individual state pension plans to find more data. Pension plans typically report how many workers retire each year, as well as their average pension. We could find the teacher pension plan in each state and dig out this information. But there are issues here as well. Because teachers are typically enrolled in pension plans with all education workers, including principals, school support staff, and district personnel, the plan's new retirees would include more than just teachers. (Some states put teachers into pension plans with other state workers, college and university employees, or other public employees. The numbers would be even more distorted in those states.)
We'll be doing more research on this going forward. In the meantime, use the SASS data for national estimates or look to state pension plans, with the above caveats in mind.
Taxonomy:New Jersey teachers are furious. Last week, the state Supreme Court made a surprising decision, allowing Governor Chris Christie to skip payments that he promised just a few years ago. In one New Jersey county, public school teachers are protesting with a “black-out,” wearing signs showing the number of pension payments they have made over their teaching years. Teachers are wearing signs with varying numbers—20, 160, 260, 552, 780—representing their individual payments as well as their differing years of experience.
New Jersey teachers have every right to be upset. After all, the Governor proclaimed in 2011 that his signature bipartisan pension reform would “bring an end [to] years of broken promises”—only to later break his own promise.
But these teachers could just as easily protest their shortchanged benefits. A teacher with 20 contribution payments, has about a year’s worth of teaching (assuming two monthly payments, or 24 per year) and isn’t going to qualify for a pension for another 216 payments or 9 years. Similarly, a teacher with 160 payments, or almost seven years of teaching, won’t qualify for a pension for another 96 payments. This is because the state requires a 10-year minimum vesting or service requirement (a practice that would be illegal in the private sector, where plans are federally regulated).
Neither of the above teachers actually have a pension yet, even though they’re contributing toward it, and close to half of the state’s new teachers won’t qualify for a minimum pension according to plan assumptions. But even teachers who have made over 260 payments, or who have about 11 years of teaching, are just about to accrue pension benefits and will most likely also leave shortchanged. In many cases, teachers will actually end up paying out more towards the system in contributions plus interest than what they will get back in benefits—basically losing money—according to research from the Urban Institute. Because pensions accrue wealth unevenly and primarily at the back end, teachers who stay less than a full career will accrue minimal benefits, often with a negative net return.
While Governor Christie has shortchanged the pension fund, the system itself is shortchanging the majority of New Jersey teachers. Unfortunately, because of the lack of transparency and byzantine nature of pension systems, many teachers may not realize this.
Taxonomy:We tend to talk about teacher retention as a national problem. The stat that “half of all teachers leave within 5 years” may have seeped into public consciousness, but it’s not true today and was never quite right anyway.
We also intuitively understand that teacher retention varies across districts and schools. We need to spend more time grappling with the consequences of those variations—teacher turnover affects everything from student learning to teacher retirement savings—but we also need to spend more time quantifying where it exists and what it looks like.
To see how much teacher experience levels vary across states, I ran the table below from NCES’ Schools and Staffing Survey. Each column shows the percentage of the state’s teacher workforce falling into various bands based on the number of years they had served in public schools. The data come from the 2011-12 survey administration, so they represent each state’s teaching workforce in that particular school year.
Nationally, 23.6 percent of the nation’s public school teachers had five or fewer years of experience. The largest category was teachers with 11-20 years of experience; slightly less than one-third of all public school teachers fell into that group. Fourteen percent of teachers had 21-30 years of experience, and another 5.7 percent had 31 or more years of experience.
Although state totals tended to cluster around the national averages, there are some extreme outliers on either end. Delaware, Louisiana, Alaska, Mississippi, Maryland, Arizona, the District of Columbia, Utah, and Hawaii all had comparatively inexperienced workforces. On the other end, Montana, Vermont, Indiana, Iowa, Maine, North Dakota, Wyoming, and South Dakota had relatively more experienced teachers. Other states, like Rhode Island and Nevada, had higher concentrations of teachers in that middle band of experience, meaning they had comparatively few newcomers and few long-term veterans.
Percentage of Teachers By Experience Levels (full-time, public schools only) State
5 years or less
6-10 years
11-20 years
21-30 years
31 or more years
Alabama
19.5
25.4
33.7
16.0
5.5
Alaska
30.2
19.6
33.5
11.9
4.8*
Arizona
32.7
25.7
25.2
12.5
3.8*
Arkansas
26.2
18.3
29.3
15.7
10.4
California
19.6
24.6
37.3
13.0
5.5
Colorado
27.0
25.8
35.5
8.2
3.5*
Connecticut
21.5
22.5
34.0
12.9
9.1*
Delaware
30.0
23.3
28.7
13.5
4.4*
District of Columbia
34.8
25.4
23.7
9.8*
6.4*
Florida
25.8
26.7
28.0
14.9
4.6
Georgia
19.4
26.5
35.5
14.2
4.3
Hawaii
43.0
29.1*
15.4*
10.5*
2.0*
Idaho
25.2
20.1
31.6
17.9
5.2*
Illinois
25.9
25.7
30.1
13.5
4.8
Indiana
24.3
16.4
31.4
14.9
12.9
Iowa
20.3
21.5
29.8
17.3
11.1
Kansas
26.2
18.8
28.2
18.9
7.9
Kentucky
24.7
23.3
34.0
15.3
2.7*
Louisiana
30.1
18.3
27.9
15.8
8.0
Maine
17.6
18.9
33.7
17.8
12.0
Maryland
32.6
21.0
25.4
14.9
6.1
Massachusetts
26.5
25.7
31.0
11.7
5.0*
Michigan
18.9
25.6
38.1
13.9
3.6
Minnesota
21.2
21.3
36.1
15.4
6.0
Mississippi
30.2
25.3
27.5
12.7
4.3*
Missouri
27.2
25.9
29.0
14.0
3.9
Montana
25.5
19.4
27.7
16.8
10.6
Nebraska
24.0
17.8
31.7
16.4
10.0
Nevada
17.6
30.7
36.1
12.4
3.2*
New Hampshire
22.0
26.1
27.7
15.6
8.6
New Jersey
23.3
24.8
33.8
13.6
4.5
New Mexico
21.6
24.0
33.8
16.2*
4.3
New York
16.5
26.4
38.9
14.3
3.8
North Carolina
24.8
24.8
31.1
16.1
3.2*
North Dakota
24.8
16.0
28.0
20.6
10.6
Ohio
19.6
21.3
37.0
15.4
6.7
Oklahoma
25.2
17.6
33.7
16.1
7.3
Oregon
23.0
28.7
29.5
15.4
3.5*
Pennsylvania
22.4
26.0
32.1
13.1
6.3
Rhode Island
18.6
27.5
39.1
13.5
1.4*
South Carolina
21.0
23.1
28.8
16.8
10.3
South Dakota
21.7
14.5
31.7
20.6
11.5
Tennessee
28.9
20.6
29.6
15.1
5.7
Texas
26.6
27.8
26.6
13.9
5.0
Utah
36.6
24.2
20.1
13.4
5.7*
Vermont
23.2
16.3
33.0
18.2
9.4
Virginia
22.4
25.6
28.0
15.7
8.3
Washington
21.4
21.9
30.3
18.8
7.6
West Virginia
27.8
20.2
25.7
18.9
7.4
Wisconsin
24.3
19.2
37.2
14.3
5.0
Wyoming
21.3
16.1
30.9
17.0
14.6
National Average
23.6
24.3
32.0
14.4
5.7
*Interpret with caution. Sample size is too small to provide stable estimates.
To be clear, these results are not just about teacher retention rates. They also reflect hiring trends. States that hire more teachers than they lose through attrition will tend to have a less experienced workforce, even if their retention rates for individual teachers stay the same. (This is a big part of the why the national teacher workforce has changed so dramatically. As districts cut pupil/teacher ratios from almost 19:1 in the early 1980s down to almost 16:1 today, they hired many more teachers than they lost. By making the choice for lower pupil/ teacher ratios and class sizes, it was inevitable that we’d end up with a less-experienced workforce.) I’ll come back to this distinction in subsequent posts.
These figures are merely a snapshot in time and do not indicate how each state’s workforce is changing over time. But the data suggest that some states should be investing much more heavily in teacher recruitment and retention efforts, while other states may have a harder time dealing with the coming retirements of the Baby Boomer generation.
Policymakers would be wise to consult this sort of data to set priorities within their states or school districts. While we tend to talk about the “teaching profession” as monolithic, there are significant differences across and within states.
A number of charter schools offer innovative retirement plans, opting out of their state’s pension system and instead providing alternative plans for their teachers. But only about a third of states allow charters to do this. The majority of states with charter schools require them to remain in the state’s pension system, to the disadvantage of many charter school teachers.
Colorado, unfortunately, isn’t an exception. Some charter schools offer add-on plans, but teachers must still participate in the Colorado Public Employee Retirement System (CoPERA). CoPERA provides ample benefits for those who stay in the system for 30 or more years because benefits are backloaded, but is less than ideal for those who don't stay for a full career.
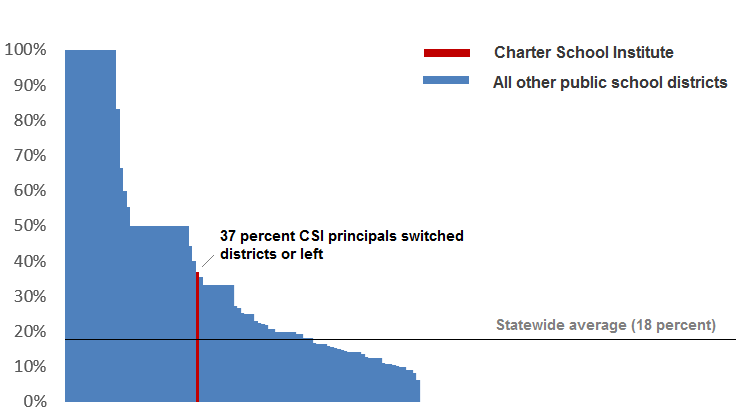
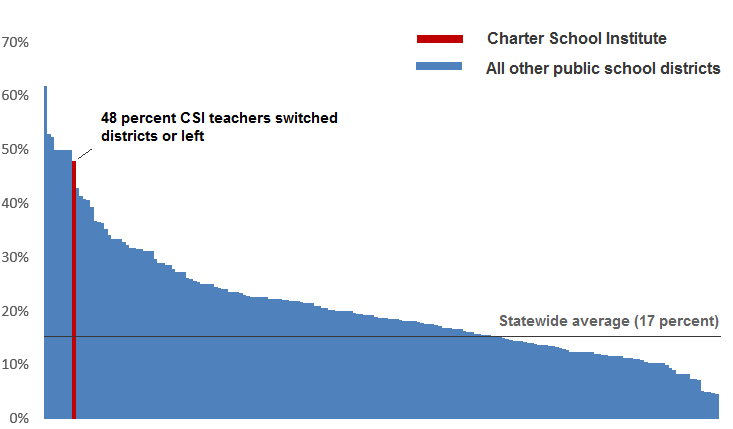
Last week, Chalkbeat Colorado reported on teacher turnover across the state’s school districts. Colorado districts with higher poverty rates saw higher teacher turnover, including the Charter School Institute (CSI)—the state’s only non-district charter school authorizer. (There are about 170 total charter schools in Colorado, and CSI currently authorizes 34 of them.) The graphs below come from the same data set. Statewide, about 17 percent of Colorado’s public school teachers left during the 2013-14 school year, and the median district had a one-year teacher turnover rate of 19 percent. CSI schools collectively had a turnover rate of 48 percent, making its turnover ratings the ninth highest in the state.
Colorado Teacher Turnover, 2012 – 13
Compared to teacher turnover, CSI principals collectively had a slightly lower average turnover of 37 percent during the 2013-14 school year and ranked 39th in the state.
Colorado Principal Turnover, 2012 - 13
Source: Colorado Department of Education, "Personnel Turnover Rate By Position," 2014.
Higher turnover rates, however, also mean CSI teachers and principals, both of whom participate in CoPERA, will get less in return. Charter schools and their teachers pay the same employer contribution rates (18.35 percent) and employee rates (8 percent) as all other schools, regardless of how long a teacher has been in the system or plans to stay. In other words, charter schools pay into the system but their teachers don’t receive as much in return. Charter schools—and any other urban or rural school with high turnover—are essentially subsidizing benefits for those who stay.
This is no secret. CoPERA actuaries actually estimate future costs based on the assumption that most new teachers will leave before a full career while paying full contributions. According to the plan’s statewide assumptions, 64 percent of new Colorado teachers will not meet the requirements to qualify for the state’s defined benefit formula. For teachers and staff who stay less than five years, the state offers a money purchase plan, where teachers can get a full refund of their original contributions plus three percent interest, but they get none of their employer’s 18 percent contribution, nor do they qualify for Social Security benefits. If we use the 2013-14 CSI turnover and assume that the same proportion of teachers leave the system each year, less than four percent of teachers would remain from the original group five years later. Less than 10 percent of CSI principals would remain.
Although these data suggest CSI is an extreme example, it is by no means alone. Any district with above-average turnover is essentially subsidizing retirement benefits for those with a more stable workforce. The bigger the disparities in turnover, the more that richer districts benefit from the turnover in poorer areas.
But it's not just teachers in stable, wealthier districts who deserve secure retirements. All teachers need flexible retirement plans that allow them to earn adequate retirement savings no matter where life takes them. If Colorado and other states allowed charter schools to opt out of the state pension system, these schools could create plans that better fit the needs of their employees. Until then, they’re most likely funding the retirement benefits for everyone else.
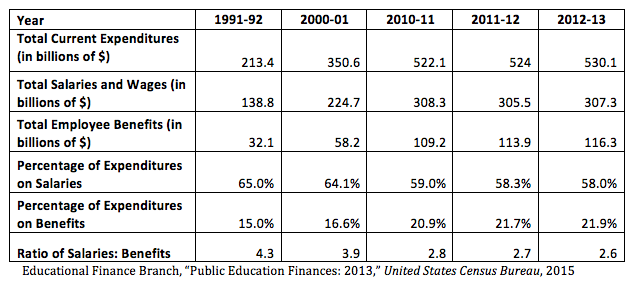
The Census Bureau’s annual Public Education Finances compiles total education spending and revenue across the entire country. The latest data shows teacher benefits continue to chip away at school budgets.
Public school expenditures have more than doubled since 1992 (including inflation), and the percentage of those funds spent on teacher benefits has increased as well. The percentage spent on teacher salaries, however, has dropped. The table below captures various education expenditures* by all public schools across the country over time.
Employee benefit expenditures include costs such as retirement plans and health insurance. School district expenditures on benefits leapt over 99 percent since the early 2000s, and climbed steadily over the past three years, now taking up nearly 22 percent of the budget. Spending on salaries increased by just 37 percent during this same window.
As a share of total expenditures, benefits are also increasing and they now eat up five percentage points more than in 2001. Over the same time period, the percentage spent on teachers’ day-to-day wages has declined, down over six percentage points since 2001.
The changing ratio of salaries to benefits is troubling. Increasing spending on benefits saps already limited funding, and prevents districts from taking on new teachers or rewarding experienced ones with raises. A low starting salary could also serve as a deterrent to those considering the teaching profession and could potentially keep talented new graduates from pursuing teaching roles.
*Note: Data do not include capital costs or debt, just current spending
Taxonomy: